
Bitcoin and Ether Market Update August 5, 2021

The total crypto market cap lost $25 billion from its value for the period since Monday and now stands at $1.58 trillion. The top ten coins are mostly flat for the last 24 hours with Polkadot (DOT) leading the group with a 4.5 percent of increase. At the time of writing bitcoin (BTC) is trading at $38,144. Ether (ETH) is at $2,628.
BTC/USD
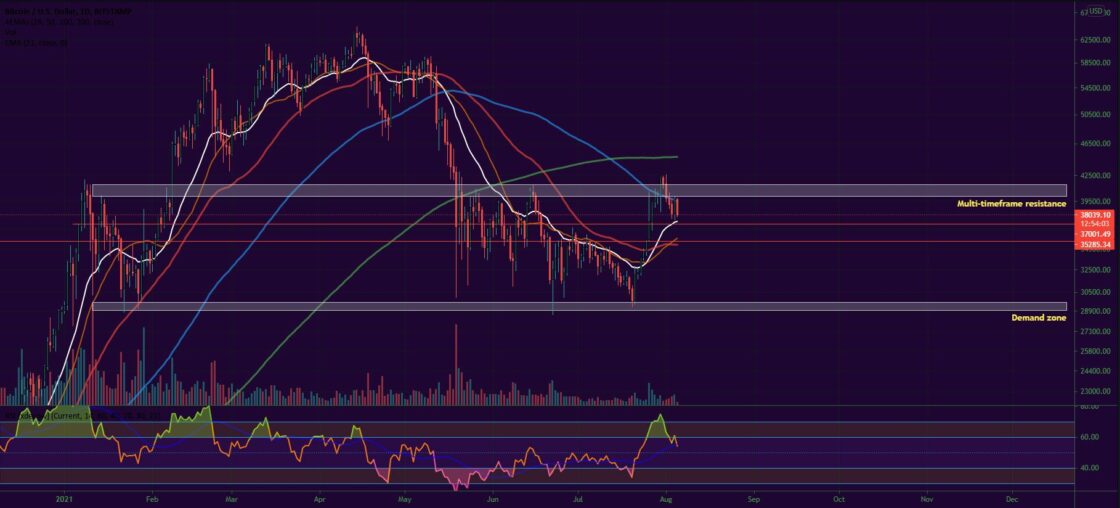
Bitcoin ended the month of July with a solid 17.7 percent of price increase on a thirty-day basis and 41 percent in total since the $29,250 low.
On Sunday, August 1, it closed the weekly candle above both the 21-period EMA and the previous high thus making a new higher high at $39,800. On the other hand, it found itself still in a resistance area and near the right shoulder of the big Head and Shoulders pattern on the weekly timeframe. This figure was previously invalidated back in early July when the leading cryptocurrency made a fakeout breaking down to $29,250 – an event that triggered the latest uptrend.
On Monday, the BTC/USDT pair registered its third consecutive day in red after peaking at $42,658 on August 1. It ended the session at $39,159 with a 1.7 percent loss.
The sell-off continued on Tuesday with a fresh 2.5 percent drop down to $38,145. Buyers were still hoping for a Wyckoff accumulation kind of healthy pullback that would eventually result in uptrend continuation.
The mid-week session on Wednesday was indeed a good one for bulls. BTC formed a bullish engulfing candle up to $39,716.
What we are seeing midday on Thursday is the exact same candle but in the opposite direction as the biggest cryptocurrency is currently unable to confirm the reversal pattern.
ETH/USD
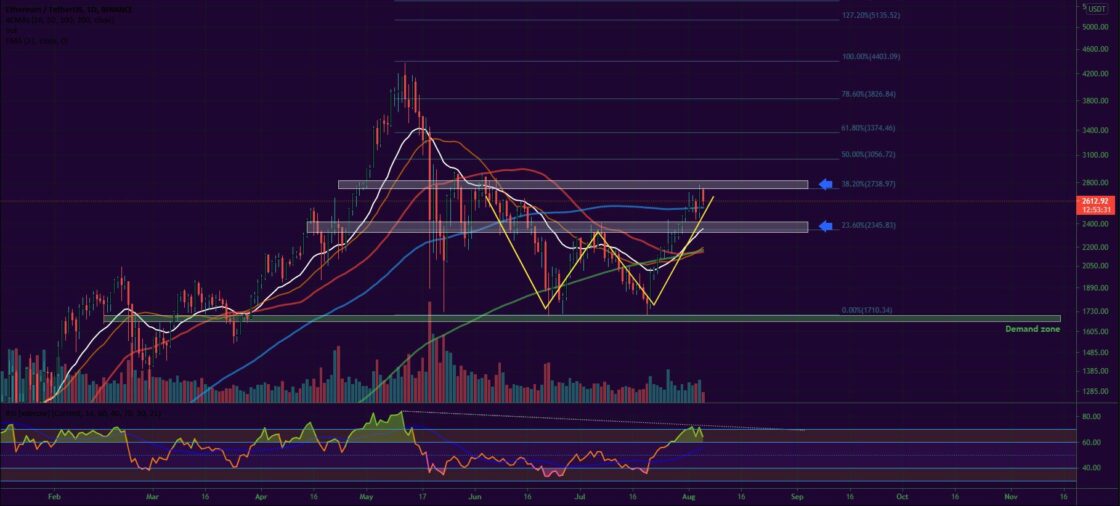
The Ethereum Project token ETH formed 13 consecutive green candles on the daily chart as of August 2. This incredible run was attributed to the upcoming London fork, also know as EIP-1559, which is scheduled for August 5 and is expected to bring transaction fees improvement and introduce a somewhat deflationary mechanism to its native token ETH.
The coin closed the seventh month of the year with a 10 percent increase after jumping up from the extremely stable demand zone near $1,700 two weeks earlier.
On Sunday, August 1, the ETH/USDT pair also managed to ensure that the weekly candle closes above the previous high on that timeframe, also surpassing the 21-period EMA.
The Monday session brought an extension of the rally up to $2,612, but on the second day of the week, we finally saw a pullback. The ether moved down to $2,507 in a 3,7 percent correction.
The mid-week session, however, was again all buyers as ETH climbed 8 percent up and hit the resistance zone near $2,730. This zone is also where the W-pattern (bullish reversal formation) forms its breakout point. A major Fibonacci retracement level is also situated nearby.
The leading altcoin is trading slightly lower, at $2,613 on Thursday.