
Bitcoin, Ether, and XRP Weekly Market Update: March 2, 2020

The total crypto market cap lost $34.7 billion from its value for the last seven days and now stands at $246.9 billion. The top 10 currencies are all in red for the same time frame with Litecoin (LTC) and Tezos (XTZ) are the biggest losers with 26.5 and 23.1 percent of loses respectively. By the time of writing bitcoin (BTC) is trading at $8,611 while ether (ETH) moved down to $219. Ripple’s XRP fell to $0.229.
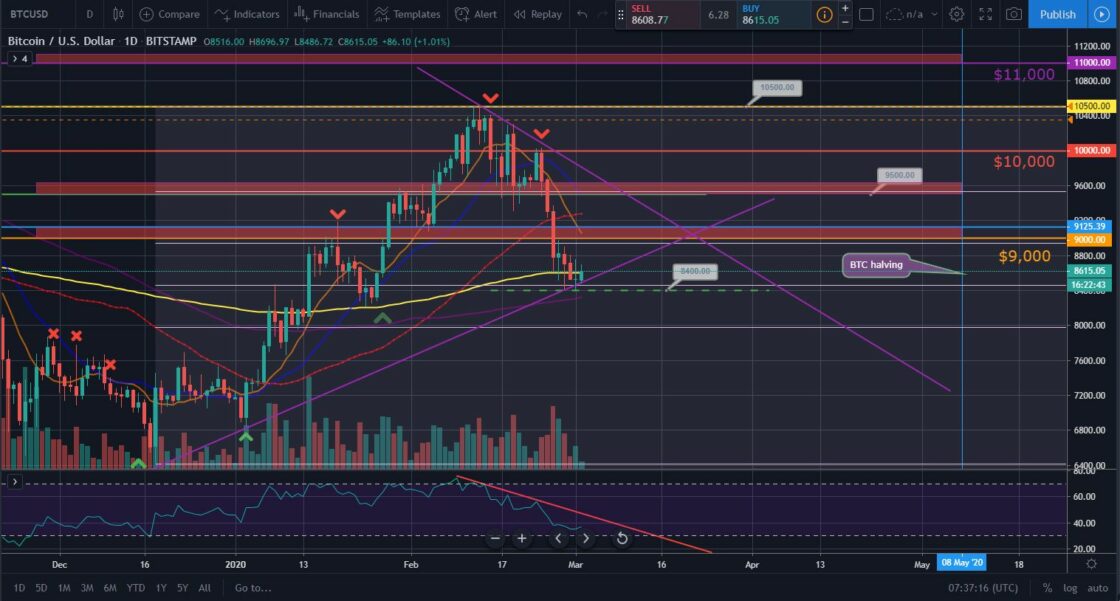
BTC/USD
Bitcoin registered one of its best sessions in the last few days and moved up to $9,968 on Sunday, February 23 adding 3 percent to its value.
The new week, however, started with a large selloff in traditional markets, which did not spare digital assets. The BTC/USD pair was rejected hard at $10,000 and erased 3.2 percent before stopping at $9,652.
24-hour trading volumes slightly increased from around $32 billion during the weekend to $38-$40 billion on Monday and Tuesday as more and more positions were liquidated. This, combined with the persisting bear pressure resulted in a sharp drop to $9,298 on Tuesday, February 25. The leading cryptocurrency broke below the $9,500 support zone (Fibonacci 23.60 level) for the first time since February 5.
The mid-week session on Wednesday was no different and BTC formed its third consecutive red candle on the daily chart. It fell below the 50-day EMA and lost another 5.6 percent of the price while breaking the next obvious support zone – $9,150 – $9,000, also near Feb 38.20. The most popular cryptocurrency stopped at $8,775 and found support at the 200-day EMA.
On Thursday, February 27 bitcoin was again highly volatile. It was moving in the $8,975 – $8,531 zone and ended the day with a small gain to $8,813.
The coin continued to slide on the last day of the workweek and fell down to $8,693. Bears manage to push price all the way down to $8,400 during intraday, but the level, in combination with the mid-term uptrend line provided the necessary support.
On the first day of the weekend, the BTC/USD pair made one step back and registered yet another losing session, this time closing at $8,517. It was 9.4 percent down for the month of February.
On Sunday, March 1, the price of BTC remained unchanged after bears made another attempt to break the $8,400 line.
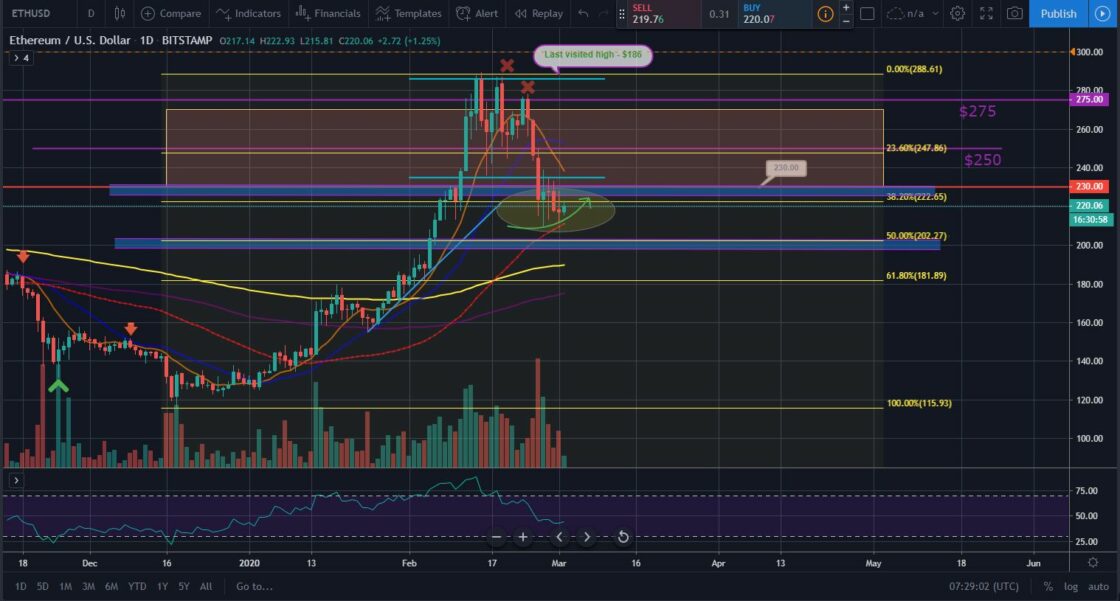
ETH/USD
The Ethereum Project token ETH climbed up to $275 on Sunday, February 23 and bulls were getting ready to test the important resistance line.
The leading altcoin opened the new trading period on Monday by following the general crypto trend. The coin closed the session at $265 after falling as low as $255 during intraday.
On Tuesday, February 25, the ETH/USD pair continued to slide and reached $246 while losing 7 percent of its value. It broke below the $250 support and did not stop in front of the Fibonacci 23.60 line at $247.
The ether nosedived to $221 in the first half of the day on Wednesday smashing through both the $230-$225 support area and Fibonacci 38.20 level at $222 to reach $214. The $222 mark was a long-standing support/resistance in the last few months. The coin managed to recover some of the losses in the late hours of trading and ended the day at $223, above the already-mentioned line.
The fourth session of the week was somehow positive for bulls as their favorite coin took a break and climbed up to $239 during intraday, closing the day with a small gain to $227.
We saw no changes in price on Friday, February 28 as the ETH/USD pair remained flat in the support area.
The first day of the weekend came with another drop, this time to $217. The ether bulls were not able to defend the $222 line, still, it closed the second month of the year with a 21 percent increase.
On Sunday, March 1, it lost $1 of its value and closed the week with a 21 percent loss.
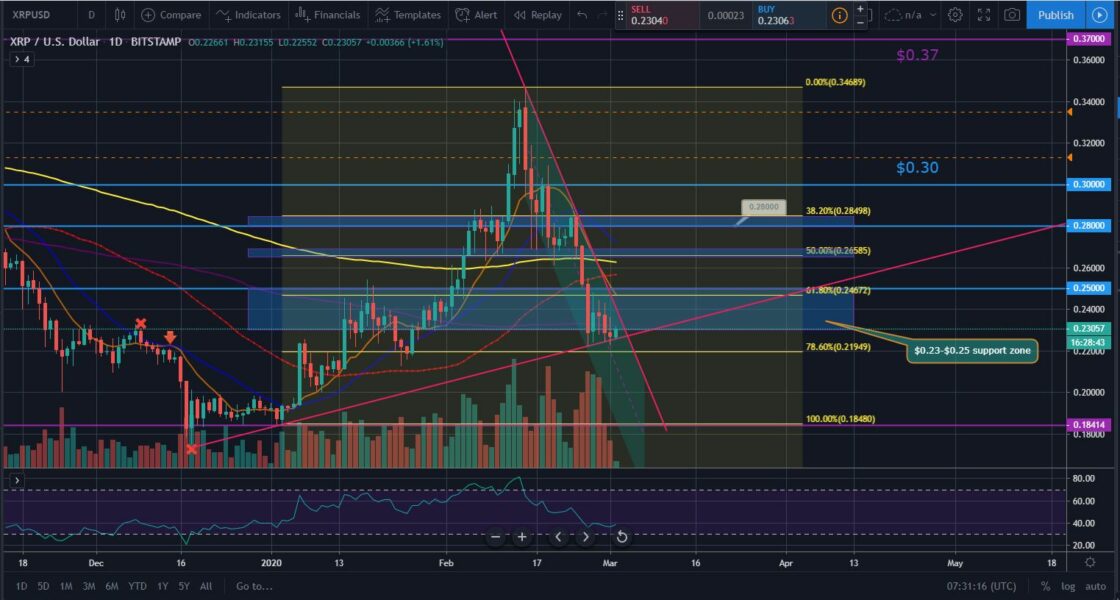
XRP/USD
The Ripple company token XRP reached the support zone around $0.28 on Sunday, February 23 and closed the week 2.7 percent lower compared to the previous seven-day period.
It opened trading on Monday by suffering a hard rejection around the $0.285 level (Fibb 38.20 line on our chart). The XRP/USD pair lost 5.6 percent of its value and dropped all the way down to the next support zone – $0.265.
On Tuesday, February 25 we saw the coin breaking below the 50 percent Fibonacci around the above-mentioned mark. The 50 and 200-day EMAs were also left behind as we closed at $0.252.
Another 9 percent of the price were erased during the mid-week session on Wednesday. The “ripple” continued to slide and formed its third consecutive red candle on the daily chart dropping to $0.22.
On Thursday, February 27 the XRP token found support around $0.22-$0.23 (right at the meeting point of the mid-term uptrend line and the horizontal support) and started to pick up the pace. The major altcoin ended the session at $0.238 in the evening after it peaked at $0.248 during intraday.
The last day of the workweek came with another volatile session during which we saw the price of the XRP/USD pair moving up and down in the $0.228-$0.243 area. It registered a small loss to $0.236.
The weekend of February 29 – March 1 started with yet another test of the current support level. The coin closed the day and the month at $0.228 but managed to keep above the mid-term uptrend line started on December 18 when we bottomed at $0.172.
On Sunday, March 1, the coin made another step back, this time to $0.226 and ended the seven-day period with a 20 percent decrease.
Altcoin of the Week
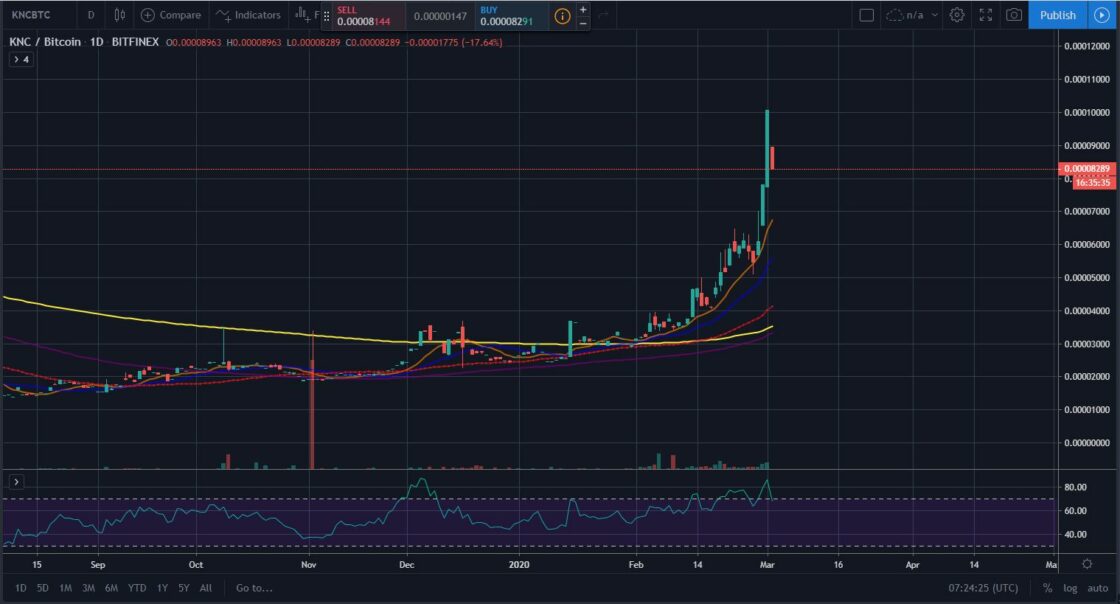
Our altcoin of the week is Kyber Network (KNC). This token is one of the few projects to register positive results for the seven-day period.
KNC added 28 percent to its value and is also 78 percent up for the last two weeks.
It registered a new 18-month high and peaked at $0.85 on Sunday, March 1.
The Kyber Network currently stands at #44 on CoinGecko’s Top 100 chart with a total market capitalization of approximately $133 million.
As of the time of writing, it is trading at 0.00008285 against BTC on Bitfinex daily chart.