

Bitcoin Price Analysis: BTC-USD Bulls Attempting a Breakout
Psychological support at $450 has now turned into resistance. Bulls are currently looking to establish a breakout and the hourly chart below shows how the price action broke support provided by the Kumo and then turned red, providing resistance. Following this, BTC-USD posted a low at $440.80. Then buying interest increased and brought the price action higher, testing resistance provided by the Kumo in $448.00 to $454.18 area. Another attempt to push prices below $440 failed and bullish momentum has brought the price back up to $445.77, testing resistance provided by the Kumo.
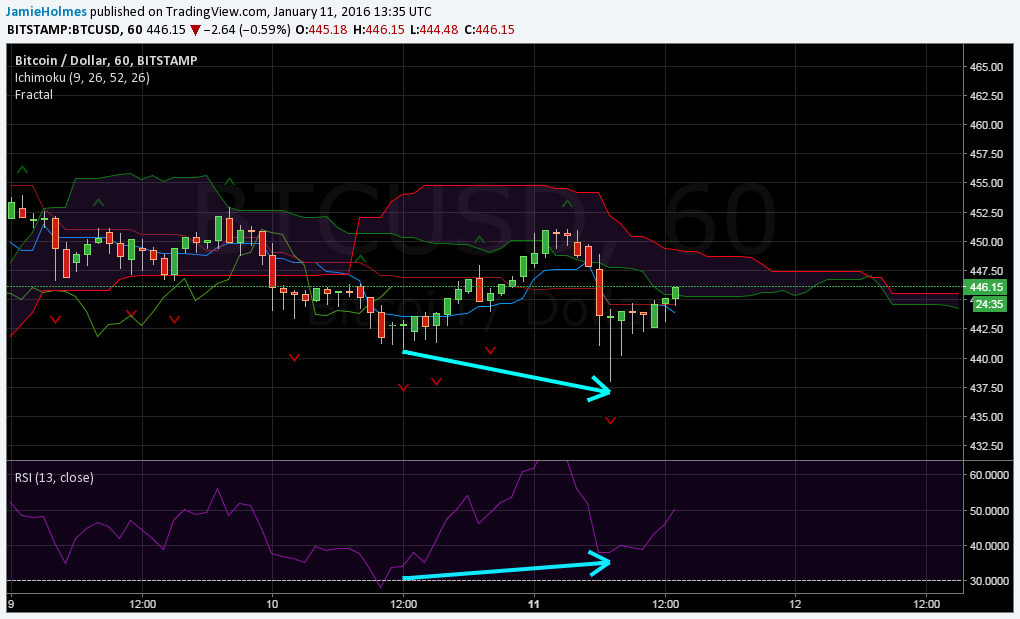
The relative strength index is showing that bullish momentum is starting to gain the upper hand. A cross above the critical 50 level looks to be imminent and will confirm a bullish outlook. Also, there is more risk to the upside as we see a regular bullish divergence pattern in the chart (indicated by the arrows). The relative strength index has made higher lows while the price action has made lower lows. This indicates bears may be exhausted and the current uptrend will strengthen.
A bullish breakout will be indicated once the price closes above the Kumo, currently at $449.30. This would see bulls targeting resistances at $451.13, $457.47 and $465.00. The price has also recently closed above the base line, currently at $444.56, indicating bullish momentum. Also, the lagging line has moved from below to above the previous price action, giving a weak bullish signal.
On the other hand, the Kumo may provide strong resistance again, and sellers should look to enter short positions once the price closes below the base line, which is providing minor support. Bearish momentum is expected to intensify with a close below the most recent buy fractal at $438.00. A break of this level should open up targets of the fractal supports at $432.67, $429.25 and $424.32.
The short-term outlook is shown in the chart below. The Kumo provides support going forward around $444.56 and shows that the price has moved above the Kumo, indicating a bullish outlook over the short-term. This is further supported by the fact that the conversion line is trending above the base line.
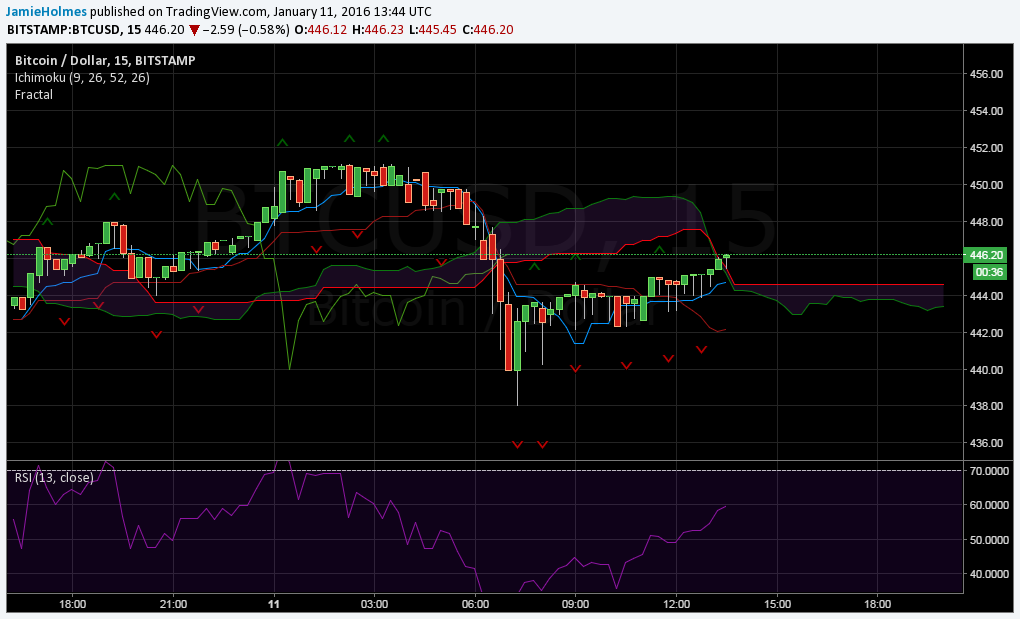
The price has recently closed above the most recent sell fractal at $445.00, providing a further bullish indication. Bulls now look to target fractal resistance at $451.13 and $452.99. The Kumo is still red in colour and further upside swings in price are anticipated after the cloud changes colour to green. The relative strength index is also trending upwards and is not yet near the overbought zone at 70. The index is currently at 59.7, suggesting more room to the upside before the market is overbought.
Sellers should look for a close below the conversion line, currently at $444.64. The base line at $442.09 provides further support, and a close below this level would give further bearish confirmation. $442.33 provides a key support level and bearish momentum will intensify if there is a 15-minute session close below this level. This would open up targets of $440.24 and $438.00.