

BTC-USD Bears Looking For Another Shot at $400

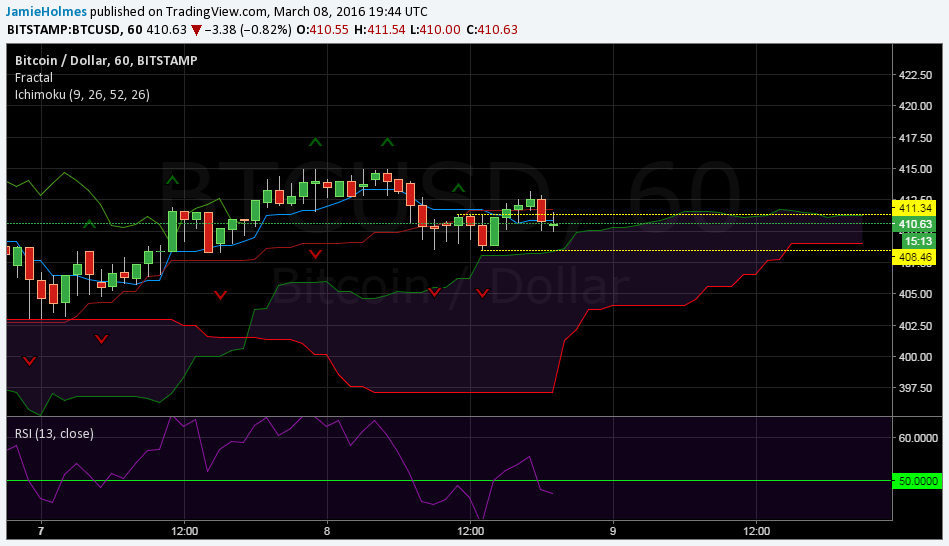
BTC-USD has seen limited price action today after two days of appreciation, currently down 0.82% on today’s open. Safe-haven assets benefited recently from disappointing Chinese trade data which has rekindled fears about the state of the global economy. The trading volume on the BitStamp exchange has fallen today, suggesting we could see further declines as trends in volumes precede trends in price. The short-term outlook is illustrated with the hourly chart of BTC-USD below.
The price action has recently closed below the base line at $411.72 giving a bearish signal. Sellers will now look to test support provided by the area inside the Ichimoku cloud around $404-$410. The most recent fractal levels are displayed on the chart by yellow rays. If the market manages to close below the most recent buy fractal at $408.46 then this will indicate bearish momentum and will see further downward moves. On the other hand, this level could provide strong support.
Also, to the upside, fractal resistance lies at $411.34 and a close above this level in an hourly trading session is required to necessitate a bullish outlook. Furthermore, a close back above the conversion line and base line would provide further bullish indications. The relative strength index has moved below 50, indicating a short-term bias to the downside for BTC-USD.
The chart below shows the daily price action for BTC-USD on the BitStamp exchange. A bearish indication was given on March 2nd when the market closed below the conversion line, signalling a higher likelihood that the price would decrease further. The market established a fresh low at $382.00 before moving higher in the past few days. The candlestick pattern for March 5th is known as a Hammer and is characterized by a red ‘head’ and long, lower wick. This formed in the Ichimoku cloud area, giving a strong indication that the market found strong support around this area.
Since we are closer to a strong support than resistance, which lies at $440.99, there is a higher chance of bullish momentum over the long-term. However, the market needs to close above the conversion line which is currently offering minor resistance at $411.49. A close above this level today will give a strong bullish signal and should see the market tend toward $450. On the other hand, a failure to close below this level should see limited price action, ranging between $400 and $411.49.
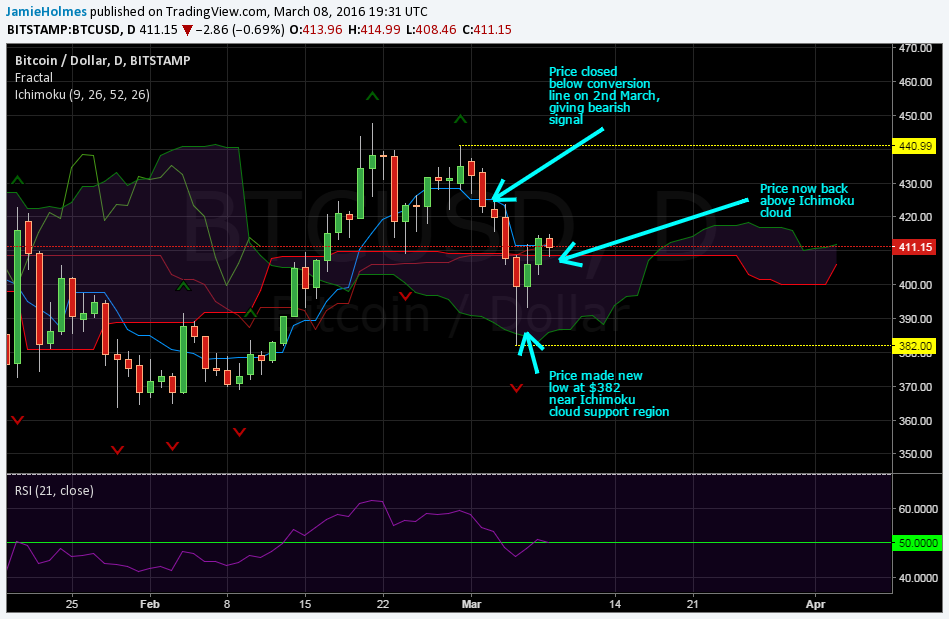
The relative strength index briefly pushed below the equilibrium 50 level but has since returned to this level, suggesting the price action will stay near to the Ichimoku cloud as the strength of buyers and sellers is identical. Sellers should look for the index to start moving below 50 to enter into short positions and to confirm longer-term bearish dominance. On the other hand, bullish dominance will be signalled over the long-term if the relative strength index starts to move above 50.