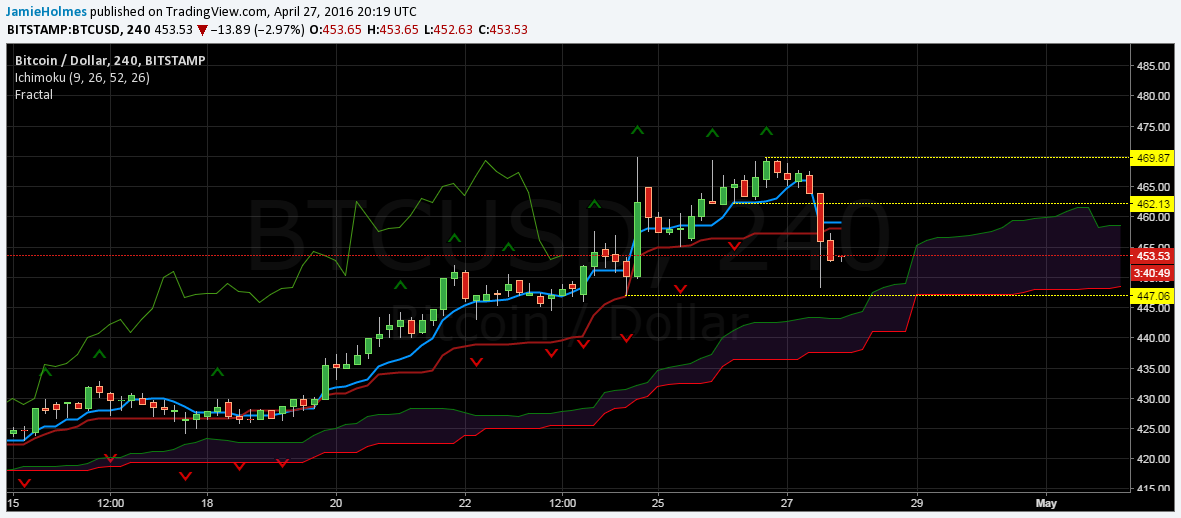

BTC-USD Down By Over 3% On Profit-taking

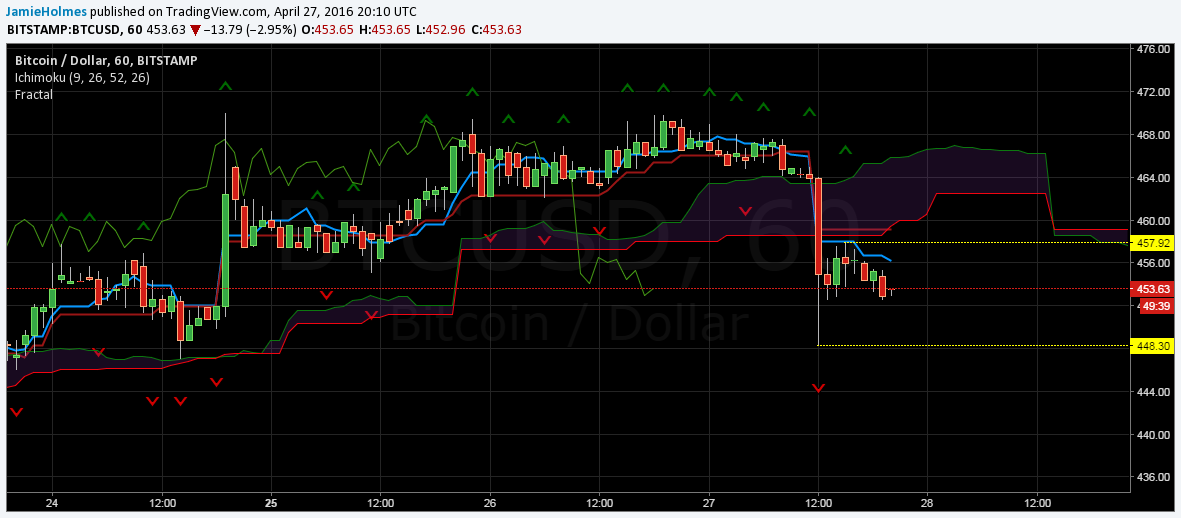
BTC-USD is trading around 3% lower than today’s open on the BitStamp exchange with the price currently at $453.65. The strong downward move could be followed by a strong trend continuation downwards as BTC-USD posted a fresh high around $470.02 on Sunday. This is mostly driven by profit-taking, where selling is dominant as people lock in their profits and sell their bitcoin. The market failed to break above the $470 psychological area and a strong move downwards was seen today, pushing the price back below $460. The chart below illustrates the short-term outlook for BTC-USD with the hourly price action, Ichimoku Kinko Hyo and fractal levels.
A low of $448.30 was posted today and formed a buy fractal at this level, indicating a critical support at this level, which will be importan watch going forward. If the price remains above $448.30 and fails to close below it, then we should be on the look-out for the first signs of trend reversal; for example, we should look to buy BTC-USD when the market closes above the conversion (blue) line. However, if the market manages to establish an hourly close below the most recent fractal support at $448.30, then we should see bearish momentum continue to dominate and propel a continuation of the current downtrend.
There is more risk to the downside as the market has pushed below the Ichimoku cloud; the cloud has changed color from green to red, and bearish momentum is indicated by the base (dark-red) line which is trending above the conversion line. Bears are looking to target fractal support at $446.04. A bullish outlook is only validated if there is a close above the conversion line, currently offering minor resistance at $456.20. The base line, currently providing minor resistance at $459.09, will then be targeted if the market closes above the conversion line.
The most recent sell fractal was formed at $457.92 and acts as a key resistance level going forward. If the market breaks above this level and sustains above this level, then we should see a trend reversal and a shift toward bullish momentum. Bulls will then eye psychological resistance at $465. However, if the market remains below this level then bearish momentum will continue to dominate. Also, market participants should look for any signs that the cloud is starting to trend downward as this will foretell an extension in the downward movement.
The longer-term outlook is illustrated below with the 4-hour price action. The market attempted to break the fractal support at $447.06 but got rejected. A break of this level could see the market extend as deep as $432.87. A weak bearish signal was given recently as the market managed to close below the base line, signalling downward pressure may dominate further. It tells us that we should prepare for the market to test support provided by the Ichimoku cloud currently around $437-$443. If the conversion line crosses below the base line, then this will give further evidence of a longer-term bearish move in the market.
The most recent fractal support and resistance level are indicated on the chart as well as immediate fractal support at $447.06. The market has closed below the fractal support at $462.13 twice at present, depicted below, giving a strong indication that we have a trend reversal in play not a pullback. Fractal resistance is seen at $469.87 and would serve as an initial target for buyers if there is a reversal in the current downward trend. Further bearish confirmation will be given if the Ichimoku cloud, which is still green, changes color to red.