

BTC-USD Encountering Critical Resistance at $428

In the previous article, it was suggested that sellers should enter short positions around the base line and the market unfolded as such. The price action tested resistance at the base line, around $428.65 USD, then bearish momentum gripped and pushed as low as $419.63. But then momentum shifted again in favor of the bulls, moving the price higher above $430. The current price on the OKCoin exchange is hovering around $425.
Medium-term outlook
The chart below shows the 4 hour price action on the OKCoin exchange. The Ichimoku cloud has stopped trending downwards and has started to move sideways, indicating that the market is deciding on the next direction. The chart illustrates that the price is resting firmly below a critical resistance area and very close to the ‘equilibrium price’.
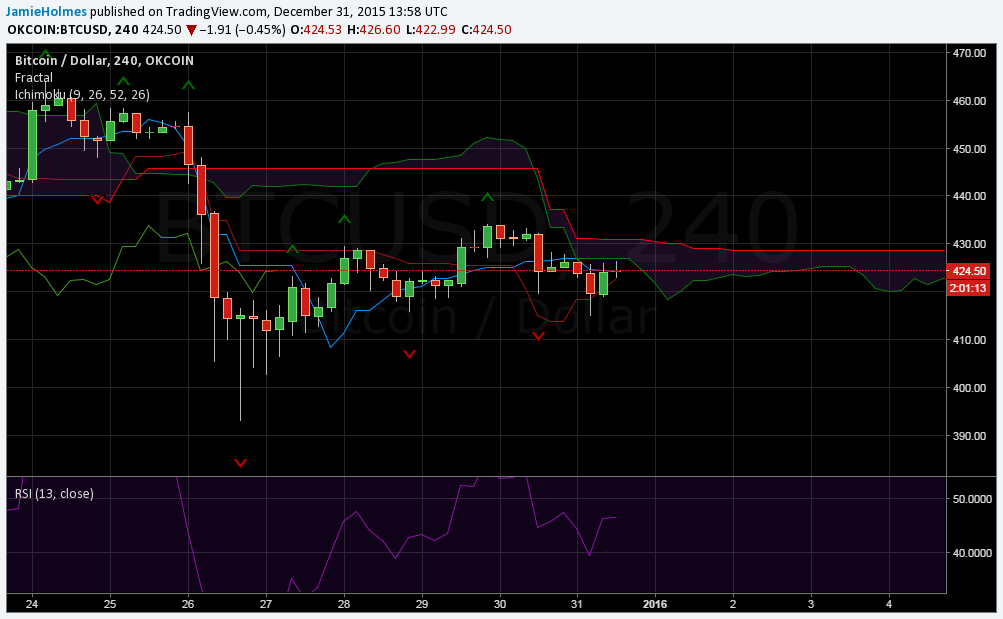
Bullish scenario
From the chart below, we see a cross-over of the conversion (blue) line and the base (red) line. This is interpreted as a shift in momentum from bearish to bullish. Also the price action crossed below the conversion and pushed to a recent low of $415. However, since then the price has moved back above the conversion line, it suggests a higher probability of the upward movement continuing. In the medium-term, the key level for BTC-USD to surpass is $428.65. A break above this level should see buyers enter the market and the target in this case is the $460 region.
Bearish scenario
On the other hand, the Ichimoku cloud shown above may hold as strong resistance and would push BTC-USD back to recent lows around $393. The relative strength index is trending down and also below the 50 benchmark suggesting sellers are still in control. A close below the base line, currently at $422.62 will necessitate a bearish outlook over the medium-term with immediate supports at $416 and $400.
Short-term outlook
The price action has started to trend downwards with support expected and illustrated below around $420 by the Ichimoku cloud. Short-term bearish momentum seems to be dominating with the Relative Strength Index moving lower just touching the 50 benchmark. The risk is more towards a bearish outlook over the short-term.
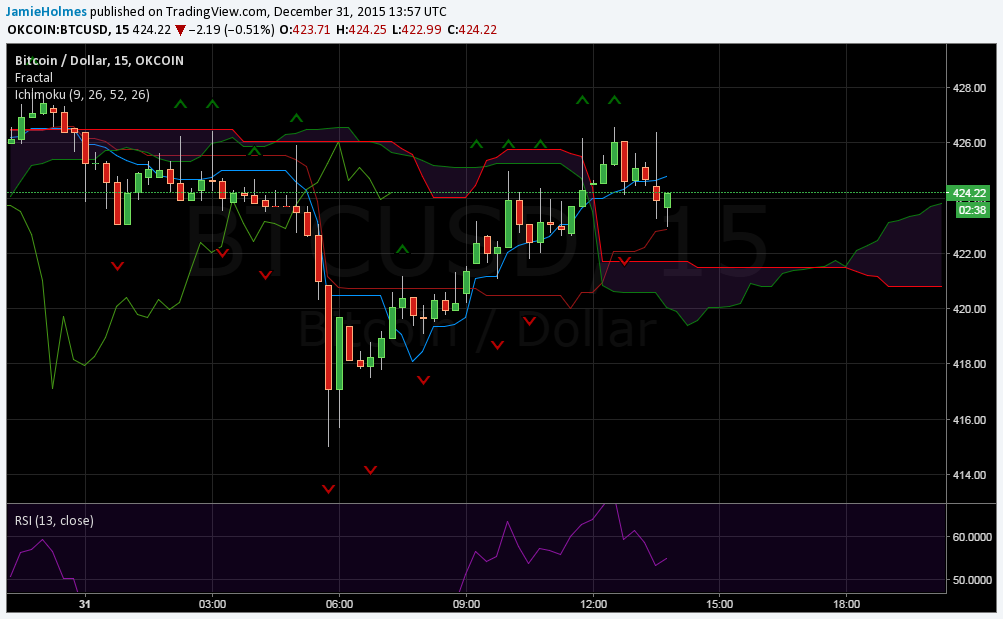
Bullish scenario
A move back above the conversion line is required to necessitate a bullish outlook in the short-term. Buyers should pay close attention to the price action and the base line, which provides support at $422.85 at present and could mark a turning point in momentum. Buying interest will also be found around the Ichimoku cloud. In the short-term, a break above the most recent sell fractal at $426 should provide enough bullish momentum to test the recent high of $433.37. Also, the relative strength index is still above 50, supporting bulls.
Bearish scenario
Recently, the price action has crossed below the conversion (blue) line, indicating a higher probability of further downward moves in the short-term. Moreover, it has also broken the support provided by the most recent buy fractal at $424.14. Sellers should be ready to capitalise on a movement below 50 for the relative strength index as it will indicate a shift in momentum. The base (red) line will now act as minor support going forward and bearish momentum will intensify if the price closes below this level, currently at $422.85. A close below the base line should see an extension well below the Ichimoku cloud in the short term.
In summary, the price action needs to maintain above $428 for bulls to take control. Bears are currently pushing the price down looking to test recent lows at $415. A break below this level will see sub-$400 exposed.