
BTC-USD Finds Support Around $410, Shifts Momentum

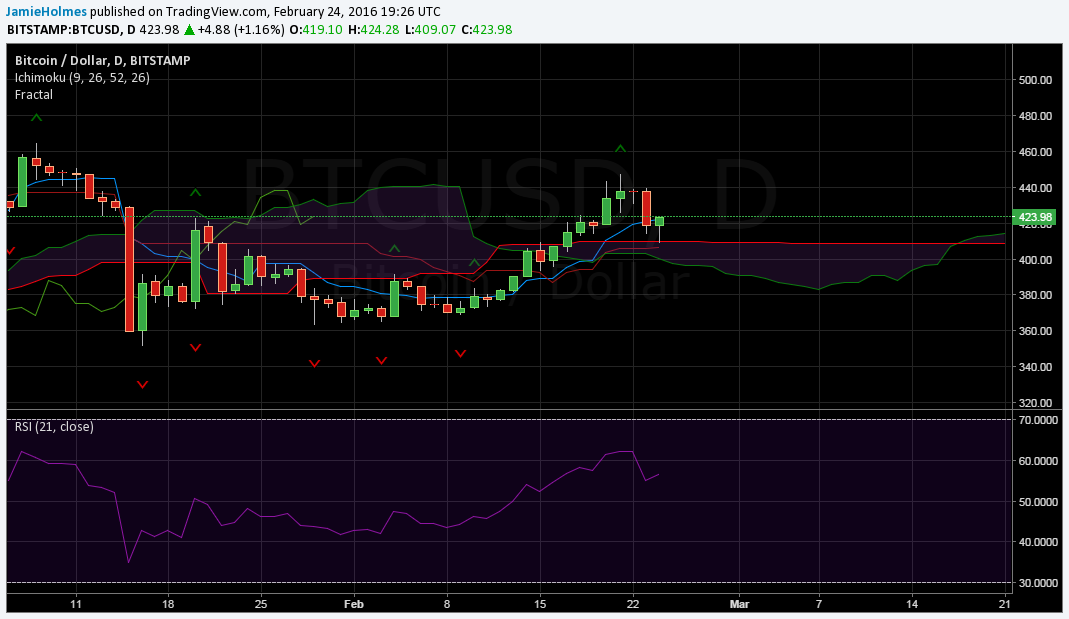
After strong selling pressure yesterday, which saw the price of Bitcoin lose almost $20, BTC-USD has bounced upward today. The price at the time of writing is $423.98 on the BitStamp, up by 1.16% on yesterday’s close. The chart below shows the daily price action and illustrates that the price has bounced upward today after testing support at the Ichimoku cloud starting at $409.90.
There are two key things to look for at the end of today’s trading session. First, note whether or not the price closes above the conversion (blue) line which is offering minor resistance at $421.99. Second, keep an eye on the bullish hammer candlestick pattern which looks to be forming today and will confirm a continuation of the current uptrend.
The fact that a bullish hammer candlestick pattern is forming at the daily timeframe today with the lower wick of the candle just touching the Ichimoku cloud indicates that sellers have tried but failed to break support around $410-$415. Buyers should look for a close above the conversion line today, which will provide a strong bullish signal and indicate a higher likelihood of further appreciation in BTC-USD. Buyers will target the fractal resistances at $447.99 and $465.00.
On the other hand, if the price action fails to close above the conversion line, i.e. today’s close is lower than $421.99, then this could foretell a weakening bull market. Sellers would then look to move below the base line, currently at $406.34, and target the fractal support at $391.88. The relative strength index is still indicating bullish momentum will dominate since the index is still above 50 and not in the overbought area which lies above 70.
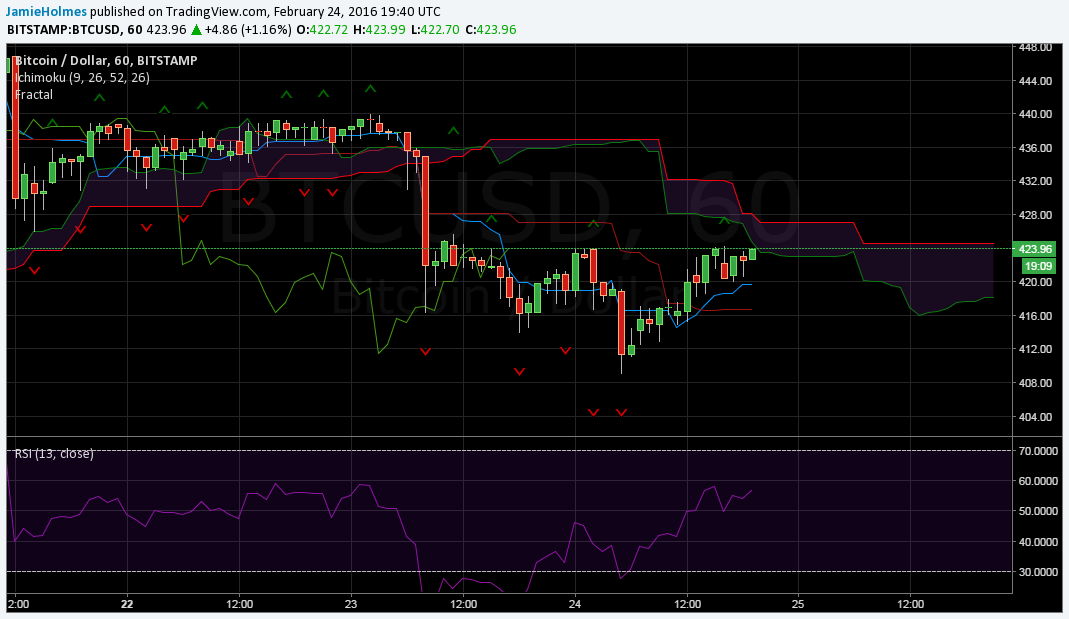
The chart below shows the short-term outlook for BTC-USD with the hourly price action and indicators. The price action is below the Ichimoku cloud but looks to be staging an attempt to break above the cloud around $427. This would be bullish and should see a move towards $465. However, if the Ichimoku cloud holds as strong resistance and the price action fails to break above this level, then this will necessitate a bearish outlook over the short term.
Bullish momentum is indicated by the relative position of the conversion (blue) line and the base (dark-red) line. The conversion line recently moved above the base line, providing a weak bullish signal since this happened while the price action was below the Ichimoku cloud. A further bullish signal has been given recently with the lagging line moving above the previous price action; both of these have increased the probability of an establishment of an uptrend and move above the cloud.
Sellers should look for a close below the conversion line to add to and/or enter short positions in BTC-USD. The conversion line is currently providing minor support at $419.62 and a close below this level will provide a strong bearish signal and the next support would be found at $416.67 at the base (dark-red) line.
The fractal analysis suggests we are very close to a resistance at $424.28, and for a continuation of the uptrend this level is key. Buyers should look for an hourly close above this level whereas sellers would be emboldened if the market fails to close above this level. The most recent fractal support stands at the recent low at $409.07, suggesting that if bulls fail to break above the most recent fractal resistance, then we could see a re-test of this low.