

ETH-USD Down Almost 6% as Bears Look to Target $8 Handle

ETH-USD has plunged almost 6% from today’s opening price on the Kraken exchange after testing the $12 psychological level over the weekend. The chart below displays the 4-hour price action of ETH-USD and illustrates a bearish outlook over the medium-term; firstly, the Ichimoku cloud has switched from green to red, indicating a shift in momentum that will favor sellers. The market looks to be heading lower with immediate support at $10.11.
The conversion (blue) line will now act as minor resistance currently at $10.90 and a 4-hour close above the conversion line will provide a weak bullish signal. Otherwise, a bearish outlook is validated. This line and the base (dark-red) line are both trending downward, suggesting the market has a stronger tendency to the downside. Bearish momentum is also indicated by the relative position of the base line and conversion line. The base line is above; therefore, we should see further downside moves unless the conversion line crosses back above the base line.
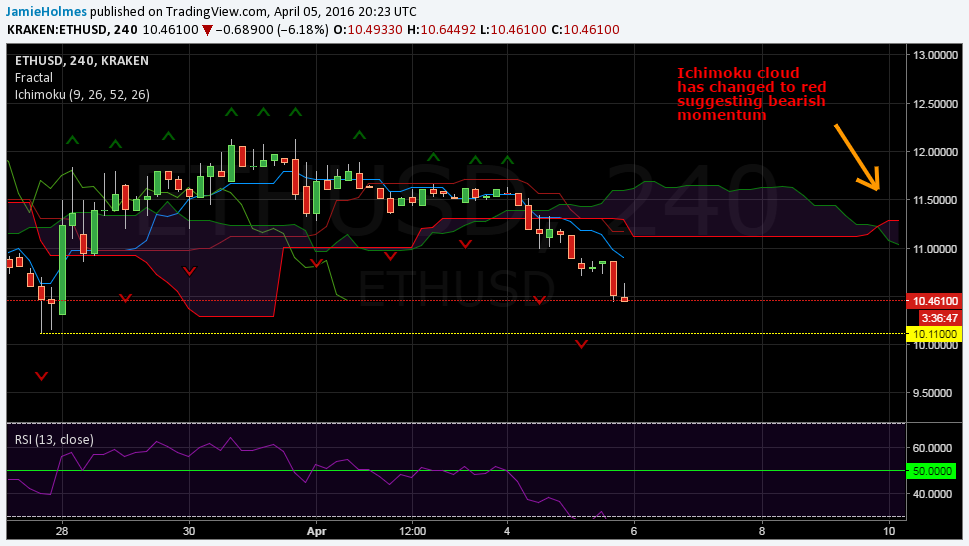
The relative strength index is indicating strong bearish momentum and the most recent fractal support has been broken. Resistance is now provided by the previous fractal support at $10.72. A break below $10.11 will see sellers target the $8.00 psychological level.
The longer-term outlook is shown below by the daily price action. A bearish outlook is provided, considering the various factors of the Ichimoku indicator; firstly, the base line has been above the conversion line for almost two weeks, suggesting bearish momentum is in play. Secondly, the market has breached minor support provided by the conversion line, which now acts as minor resistance. Therefore, we should see ETH-USD tend toward the equilibrium area represented by the Ichimoku cloud below around $7.00 to $11.00.
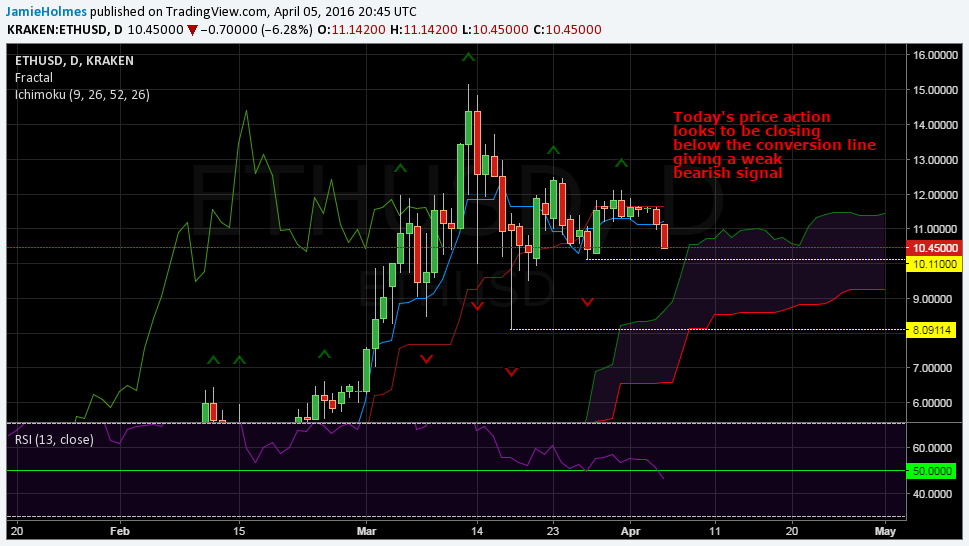
The immediate fractal supports are indicated on the chart at $10.11 and $8.09. Fractal resistance is provided at $12.13, and a break above this level is needed to validate a bullish outlook in the longer term. For now, we should expect the market to bottom out at around $8.00 before either heading back above $10.00 or pushing lower below the Ichimoku cloud; therefore, $8 is a critical psychological level going forward, which saw immense buying interest when the market was previously at this level.
Another indication we are heading for a move below $10 is given by the relative strength index; it has crossed below 50 after trending above 50 which signals a switch in momentum. Buyers should only look for long-term buys once the index indicates an exhaustion of the bearish trend, i.e. when the index pushes below 30. Alternatively, buyers could wait for confirmation of bullish momentum by waiting for the index to move back above 50.