

A Guide to Trading Cryptocurrency Part 1: Candlesticks and the Fibonacci Sequence
Anyone involved with bitcoin or cryptocurrencies needs to know at which rates are good to buy or sell in the future. Others like to trade the markets and speculate with the potential of making a profit. Either way, candlesticks and the Fibonacci sequence can be used to improve your profitability when trading the markets or when making a purchase with bitcoin.
Candlestick Analysis
Candlesticks serve as an important way to track the market’s behaviour and possible future direction. Introduced from Japan, Western traders used to only use bar charts and point and figure charts for trading commodities and stocks. Candlesticks provide a more powerful analysis as they reveal more information from the market. The open and close of the candlestick represent the ‘body’ while the highs and lows are represented by ‘wicks’.
The patterns and formations of candlesticks can provide information on where to buy and sell cryptocurrencies, as well as when to exit these positions. We will look at two simple, reliable candlestick patterns that frequently occur in cryptocurrency markets that will allow you to trade and invest more effectively. It is recommended only to rely on candlestick analysis with timeframes higher than 4 hours to provide stronger signals.
Marubozu
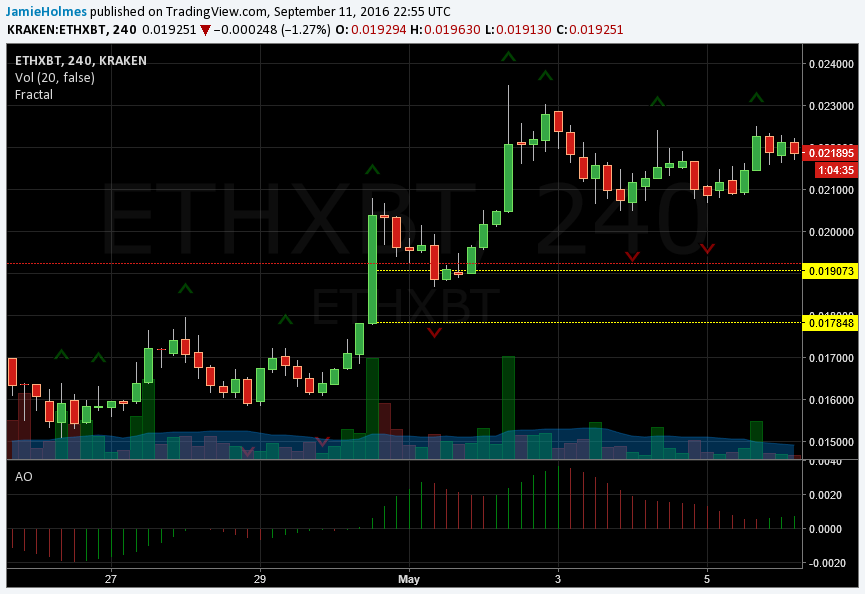
This type of candlestick formation indicates that the buyers (or sellers) were in control during the entire time period, with a large real body and small or non-existent wicks for the candlestick. For example, the chart below shows a bullish Marubozu candlestick for ETH-XBT on the Kraken exchange. This tells us that during the whole 4-hour period buyers were unimpeded in pushing the price higher and points to further gains for ETH-XBT. Since at the end of this period, the close was very close to the high, this tells us at the moment this candle closes, buyers are in control and signals a higher likelihood that price will continue to increase.
Moreover, as soon as this candlestick is formed on the close of the 4-hour trading session, we instantly have two potential entry opportunities into the upward trend. First is the base of the candlestick which provides a support level and second is the 50 percent level of the body of the candlestick itself.
The chart below shows that ETH-XBT only managed to test the 50 percent level around 0.019073 before continuing higher after a bullish Marubozu was formed. After testing this support level, the market then went on to establish fresh highs above 0.02300.
For a bearish Marubozu, the top of the candlestick and the 50 percent level act as resistance instead of support as with the bullish variation. This pattern is easy to use and very effective. As soon as a Marubozu is formed, you can set up limit buy/sell orders at close/open and the 50 percent level of the body of the candlestick.
Doji’s
While the Marubozu candlestick pattern can identify good entry points, it does not provide information on where the current trend may end. Therefore, a useful pattern is known as the Doji, which comes in many variations. However, what is characteristic of every Doji candlestick is uncertainty in the market and indecision amongst market participants.
When the Doji candlestick is found near support and resistance levels, the probability of a reversal increases substantially.
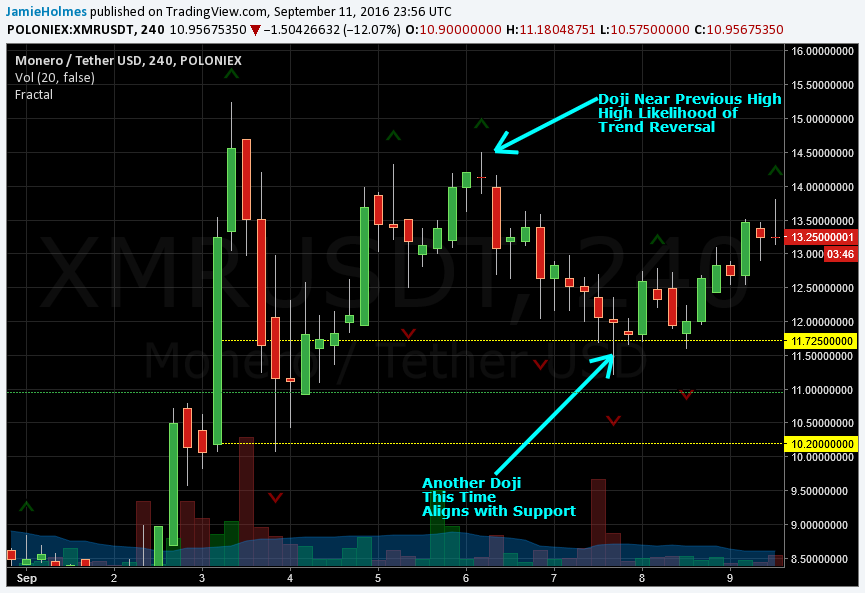
The chart below shows the price action for XMR-USD and after the bullish Marubozu we would like to buy at either $10.20 or $11.725, both of which were triggered. The question is where do we sell?
After buying at $10.20 or $11.725, we would have enjoyed rising profits for September 4 with another bullish Marubozu formed, albeit not as strong as the previous one. However, early September 6, a very ‘nice’ Doji candlestick was formed; it was very ‘nice’ because the open and close of the candlestick were very close together, meaning relatively more uncertainty is signalled than if a Doji with a larger body was formed.
Once we have seen this pattern form, we would look to exit the buy position as the Doji has formed near the previous high at $15.25. Following the Doji candlestick pattern, which closed at $14.14, the market reversed and started to trend lower, reaching a low of $11.21 on September 7.
Following this fresh low, the market managed to push higher and another Doji candlestick was formed but this time aligning with the 50 percent support level provided by the bullish Marubozu at $11.725. This indicates once again, a trend reversal and we would look to exit short positions (and enter long positions) on the close of this candle.
Therefore, when a Doji candlestick is formed, this should alert you to a possible change in momentum. However, the context of where the Doji pattern has formed is important. By evaluating the position of the Doji with respect to the previous price action, we can correctly interpret the information it conveys.
There are many other patterns, including the ‘Hammer’, which is also useful for finding reversals, and multi-candlestick patterns, such as the ‘Morning Star’, with the Marubozu and Doji patterns illustrated here as a gentle introduction. Candlestick analysis serves as a powerful tool to make better trading and investment decisions, with the Marubozu and Doji two of the most reliable patterns.
The Fibonacci Sequence
1, 1, 2, 3, 5, 8, 13, 21, 34, 55, 89, …, ∞
The sequence above is known as the Fibonacci sequence and each number is approximately 1.618 times greater than the preceding number. This is known as the ‘Golden Ratio’ or Phi, a mystical number that appears frequently in nature.
The chart below shows the 4-hour price action of Factoids against bitcoin, FCT-BTC, on the Poloniex exchange. Up until August 8, FCT-BTC was trading sideways with no clear trend but then there was a bullish breakout extending as high as 0.00456021.
Once this new high has been established, we can use the Fibonacci retracement levels to decide where to buy into this new trend. We can use the fractal levels to identify the swing low and swing high points and use the Fibonacci retracement level tool on your trading charts.
Once drawn on the chart, it will highlight entry points and targets. Firstly, the chart below shows several Fibonacci retracements levels. The 50 percent retracement is the only level not based on the Fibonacci numbers. These levels are support (or resistance) and are obtained by the ratio of Fibonacci numbers. For example, the 23.6 percent retracement comes from the fact that a Fibonacci number divided by a number three places to the right in the sequences equals 0.2360 or 23.6 percent.
So after the breakout in FCT-BTC, we can draw these levels on the chart and look to buy at 0.00357024 and 0.00333661. In general, the optimal points to enter into an ongoing trend lie at the 50 and 61.8 percent retracement levels, corresponding to 0.00357024 and 0.00333661.
At these points, we look to buy FCT-BTC. Notice that on August 13, the 61.8 percent retracement support was slightly missed and the market only managed to push as low as 0.0034000. Nevertheless, a buy at 0.00357024 would have been good enough. FCT-BTC then proceeded to break through both of the resistances provided by the 23.6 percent retracement at 0.00409294 and the swing high point at 0.00456021 in the following weeks.
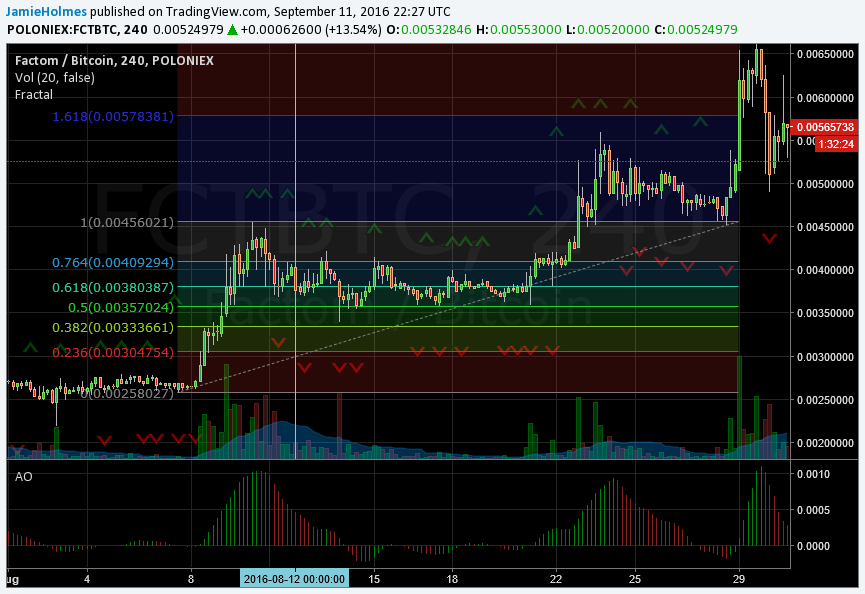
So once we have figured out where to buy after a bullish breakout, the next thing we need to determine is where to trend might reverse against us. The retracement levels serve as entry points whereas the extension levels serve as exit points.
Notice that in the chart above, the first Fibonacci extension level is shown and is the 161.8 percent extension level. Once we have placed a buy order around the 50 percent or 61.8 percent retracement, we will look to sell at the first or second extension level. With FCT-BTC, the market only managed to reach the first extension level at 0.00578381.
After buying at 0.003577024, we would look to sell at least as high as 0.00578381 or better yet even higher. However, from the moment the fresh high is made and the market makes a breakout, you can use the Fibonacci ratios to determine both your entry and exit point when following a trend.
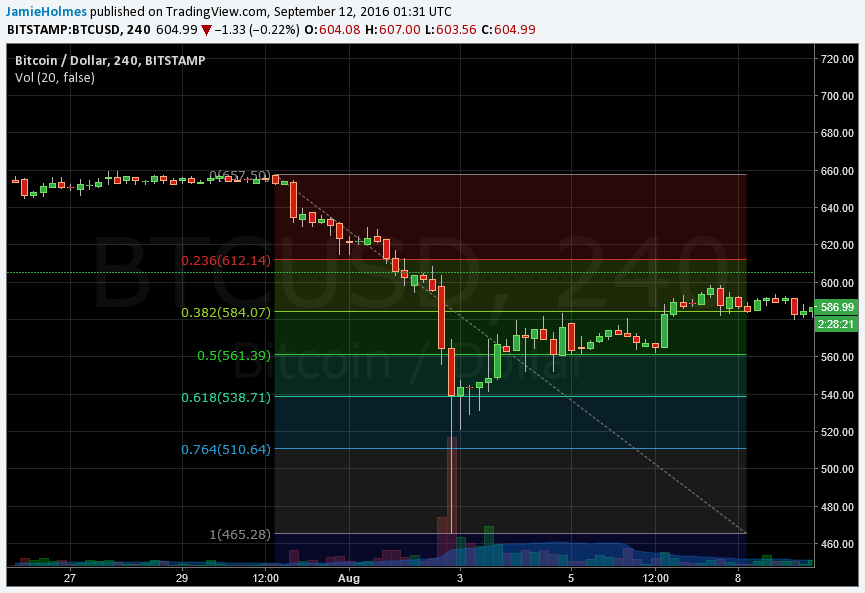
Suppose instead you hold bitcoin and make most of your purchases with it. A high US Dollar price is good for buying things with bitcoin as you have more purchasing power. The worst thing to do is to see the price going down and you think, “I better sell, it’s going down” as a reaction to the market. However, using Fibonacci ratios, you can identify resistance levels where the price will likely reach to economize and spend less bitcoin and still purchase the items you need.
For example, after the Bitfinex hack BTC-USD plunged downwards and after posting a low at $465.28, the price rebounded higher. Instead of selling during this downward move and making a panic purchase as you see the price go lower, we wait for the market to establish a low. After this downward move, we then wait for the price to test either the 50 or 61.8 percent retracement levels at $561.39 and $584.07 respectively. Then we can make our bitcoin purchase in a cost-effective way once the price is near these levels and not have to worry about market volatility.
To summarize, two of the most important candlestick patterns are the Marubozu and the Doji. The former can be used to identify good points to buy or sell cryptocurrencies while Doji’s can be used to know when to exit a trade.
Furthermore, the Fibonacci sequence can be utilized after the market establishes a breakout. Fibonacci retracement levels can be used to get in on the trend with Fibonacci extension levels used to identify where the trend may end up fizzling out.
You can read the entire series of BTCManager’s ‘A Guide to Trading Cryptocurrency’ here.