

Risk Aversion in Markets Could Signal Bullish BTC-USD

Buyers were recently only able to push the market as high as $440, missing their target around $460, but risk aversion in markets could see another attempt at this level. The critical resistance at $428 has turned into support with the price action briefly moving below this level before being pushed back up. Currently, the price on the OKCoin exchange is $435.00, higher on today’s open by 1.08% at the time of writing.
The first trading day of the New Year saw China’s stock market slump and trading was halted. Risk aversion dominated markets as Chinese indices lost 7% and as news broke that Saudi Arabia has cut diplomatic ties with Iran, boosting demand for safe havens such as gold, which has gained over 1% today. BTC-USD has mirrored this move as bulls in the market seem to be gaining the upper hand today.
Medium-term outlook
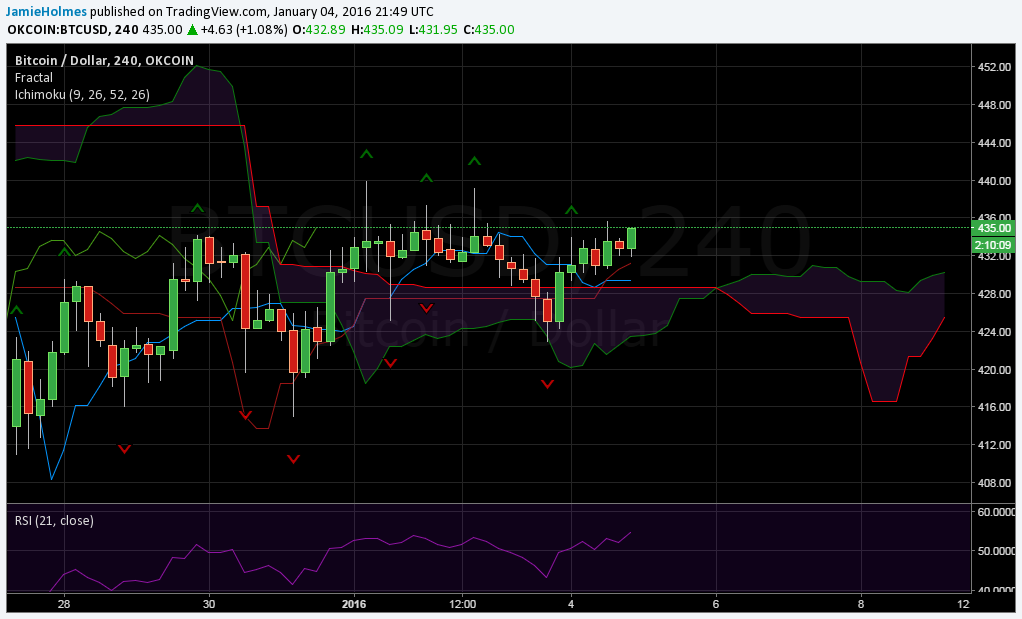
The chart below shows the 4-hour price action and as the price closed above the Ichimoku cloud, bullish momentum took the market as high as $440 before retreating to $425.15, where the cloud provided support. The Ichimoku cloud is green and starting to trend upwards indicating that the current uptrend has a higher likelihood of continuing. A daily close above $439.95 is required for a bullish outlook in the long-term. Also, if Monday’s close is higher than $433.61, this represents a strong bullish signal using the Ichimoku system at the daily timeframe.
Bullish scenario
The price is currently above $433.99, the most recent sell fractal acting as resistance and a session close above this level will see bullish momentum intensify. Highs at $439.95 will then be targeted, then $457.63 and $461.98. Buyers should also pay attention to the base (red) and conversion (blue) lines which should act as minor support going forward at $431.20 and $429.32 respectively.
Also, the Ichimoku cloud shown below in the region of $428 should also continue to provide support going forward, providing an opportunity for buyers. A strong upward trend is implied by the lagging line, since it has moved from below to above the Ichimoku cloud. Breaks above the sell fractals at $437.38 and $439.95 could see bullish momentum extend as far as $474.01.
Bearish scenario
The first bearish indication will be given when the price action closes below the base line, currently at $431.20. Then a close below the Ichimoku cloud and a move below 50 for the relative strength index will give further bearish confirmation. A session close below the most recent buy fractal at $422.90 will see bearish momentum dominate and push toward targets of $415.00 and $411.97.
Short-term outlook
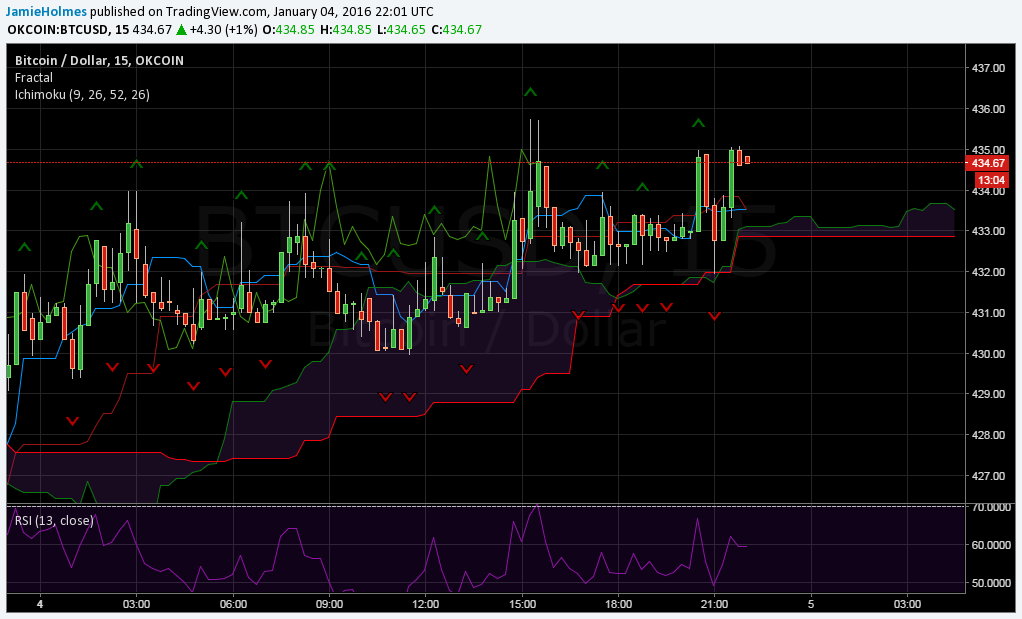
The chart below shows the short-term outlook for BTC-USD using the 15-minute price action. Notice that the Ichimoku cloud is very thin around $433, suggesting very weak support provided at this level. A break through this thin portion of the Ichimoku cloud could see momentum shift in favour of sellers. The relative strength index is above 50 at the moment in the favour of bulls.
Bullish scenario
The price is currently testing resistance provided by the fractal level at $435.00 and if this resistance level is broken, then BTC-USD should appreciate further.The next significant fractal level providing resistance is $439.27. Buyers should look to buy at support provided by the conversion line, currently at $433.52.
A bullish indication will be given when the conversion line moves above the base line and provides a strong bullish signal since the price action is above the Ichimoku cloud. The relative strength index shows there is more room to the upside as the index is not nearing overbought conditions as of yet; it is well below 70.
Bearish scenario
A close below the base line, currently at $433.84 will indicate bearish momentum and should see BTC-USD test the support provided by the Ichimoku cloud. The major risk in the short-term is that because the Ichimoku cloud is very thin, it indicates very weak support above $433.00. The base line is currently above the conversion providing an indication of bearish momentum. Sellers should look for a break below the most recent buy fractal at $431.95 and target $425 and $423.59.